Quantitative research on event-driven investing in healthcare, 2022–present: systematic strategies, event studies, and catalyst-risk modeling.
Event-driven valuation & risk in biotech
This paper explores an event-driven approach to biotech valuation, using MedinCell as a case study to illustrate how binary clinical and regulatory milestones translate into valuation risk. Moving beyond static rNPV frameworks, it applies a portfolio-based event-tree model combined with quarterly VaR and cVaR metrics to quantify the timing, magnitude, and asymmetry of downside and upside around key catalysts.
Licensing Deal Valuation
Valuation & Sensitivity for Licensing Deals covering a portfolio of products
When product identities, royalties, and milestones are only partially disclosed, headline “billion-dollar” deal values tell us very little about true economic value.
To address this, I applied a portfolio event-tree + Monte Carlo framework to build an Event-driven risk attribution showing how each milestone (IND, Phase 3 start, approval, sales thresholds) shifts portfolio value up or down, and when those inflection points occur.
How Much Is a Licensing Deal Worth When the Terms Are Unclear?
In many biotech licensing announcements, key economic details, like royalty tiers or sales-milestone thresholds, are disclosed only in broad terms. Yet these seemingly small uncertainties can dramatically alter how a deal should be valued.
Therapeutics Royalty Investments
Therapeutics royalty investments have become a distinct asset class in life sciences, providing access to biopharma innovation through diversified royalty streams. This chapter introduces a quantamental approach to valuing companies and assets in this sector.
Daraxonrasib: Independent Valuation of Royalty Pharma’s Royalty Deal
This paper presents a detailed valuation of the daraxonrasib royalty deal between Royalty Pharma and Revolution Medicines.
Using epidemiology-driven peak-sales modeling and a probabilistic scenario engine, it assesses commercial outcomes and royalty economics.
Results include rNPV, IRR, scenario distributions, and sensitivity to major value drivers.
Quarterly Update – Q3 2025: Royalty Pharma (RPRX)
This new update applies the Quantamental Valuation and Risk Framework to Royalty Pharma’s latest quarterly disclosures (November 2025). It highlights revisions to portfolio assumptions, valuation impacts, and key clinical catalysts expected through 2026.
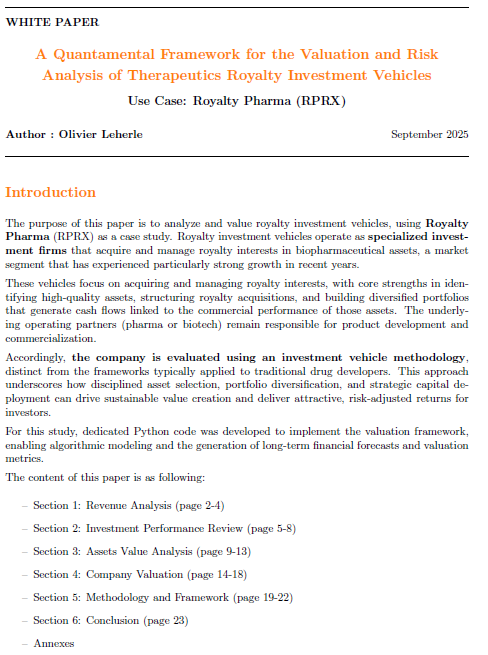
Explore my first white paper focused on the therapeutics royalty investment business.
While these companies are typically valued like traditional pharma or biotech firms, this study offers a new valuation and risk assessment perspective that better captures their distinct business model and value drivers.
Using Royalty Pharma (RPRX) as an example, the study illustrates how an investment vehicle approach can better capture portfolio performance and the drivers of long-term value creation.
It also lays the groundwork for future research, applying a data driven quantamental framework to establish consistent valuation standards for this asset class.
Systematic Strategies & Event Studies — Alternative Data (LendRx Technology, 2022–2024)
An Event-Study of Biopharma Stock Returns (2024). Using the Lend-RxNews dataset of 116,000+ press releases across 317 companies, this study measures market-model abnormal returns by event type, clinical trial phase, and company maturity, and identifies statistically significant pre-event anticipation ahead of FDA advisory committee decisions.
Quantitative Investment Strategies Using NLP Sentiment Analysis (2022). A systematic smart-beta framework driven by topic-segmented sentiment signals: constrained portfolio optimization, point-in-time universe construction, and a 5.5-year backtest with realistic data lags and transaction costs; the combined meta-strategy achieves a Sharpe of 1.11 versus 0.56 for the benchmark.
This research is provided for informational and educational purposes only. It is intended to present a conceptual and analytical framework . The material contained herein does not constitute, and should not be construed as, an offer, solicitation, or recommendation to buy or sell any security, financial instrument, or investment product.
Nothing in this paper should be relied upon for the purpose of making investment decisions or carrying out any transaction. The author and Lend-Rx SAS make no representations or warranties as to the accuracy, completeness, or timeliness of the information contained herein and accept no liability for any loss or damage arising from its use.